Your cart is currently empty!
E2E Test MapReduce Architecture: The Definitive Guide
Introduction to E2E Testing and the Need for Scale

End-to-end testing validates an application’s complete workflow from start to finish. It simulates real user scenarios across the entire system stack, including the user interface, APIs, databases, and external services. This approach catches integration issues that unit tests and integration tests miss.
Large test suites create a bottleneck. A single E2E test can take 30 seconds to several minutes to execute. Multiply that by hundreds or thousands of test cases, and execution times balloon to hours. This delay becomes unacceptable in modern CI/CD pipelines where teams expect rapid feedback on code changes.
The core problem is straightforward. E2E tests run sequentially by default. Each test waits for the previous one to finish, consuming valuable developer time and slowing down release cycles. A test suite that takes four hours to run forces teams to choose between skipping tests or delaying deployments.
Parallel execution offers a solution, but naive parallelization introduces its own problems. Tests that share state or data dependencies can interfere with each other, producing flaky results. Coordinating distributed test execution requires careful architecture.
This is where the MapReduce paradigm enters the picture. Originally designed for processing massive datasets across clusters of computers, MapReduce provides a proven framework for parallel computation. By applying this model to E2E testing, teams can split test execution across multiple machines, aggregate results, and achieve dramatic reductions in execution time.
The MapReduce approach transforms the testing workflow. Test scenarios break into smaller independent tasks that run simultaneously across distributed workers. The system then collects and combines the results into a coherent report. This architecture scales linearly with available compute resources, making it possible to run thousands of E2E tests in minutes rather than hours.
Understanding this architecture requires examining both the MapReduce paradigm and the specific challenges of E2E testing at scale. The following sections break down each component, from the mapper and reducer roles to data consistency, performance optimization, and practical implementation steps.
Understanding the MapReduce Paradigm

MapReduce solves the problem of processing large amounts of work quickly. The name comes from two distinct phases: the Map phase where work divides into smaller pieces, and the Reduce phase where results combine into a final output.
A restaurant kitchen provides a clear analogy. Imagine preparing a banquet for 500 guests. One chef cooking every dish alone would take days. Instead, the kitchen assigns different chefs to different tasks. One chops vegetables. Another prepares sauces. A third grills meat. Each works independently on their assigned portion of the work. This is the Map phase in action.
Once each chef finishes their individual task, the kitchen needs to assemble the final dishes. The chef de cuisine collects the chopped vegetables, the sauces, and the grilled meat, then plates each dish for service. This collection and combination step represents the Reduce phase.
In computing terms, the Map phase takes a large input dataset and breaks it into smaller chunks. Each chunk processes independently, often across multiple machines or processors. The system runs the same operation on each chunk simultaneously. For example, counting word occurrences in a book would split the book into chapters, with each chapter assigned to a different processor.
The Reduce phase collects all the intermediate results from the Map phase. It then combines them according to a specific function. In the word counting example, the Reduce phase would sum the word counts from each chapter to produce the final total for the entire book.
This two-phase structure offers three key advantages. First, it enables massive parallelism. Work that would take hours on a single machine can complete in minutes across a cluster. Second, it hides complexity from the developer. The MapReduce framework handles task distribution, fault tolerance, and data shuffling automatically. Third, it scales horizontally. Adding more machines to the cluster increases processing capacity without changing the code.
The MapReduce model works best for problems that can decompose into independent subtasks. Operations on large datasets, log analysis, and data transformation tasks fit naturally into this framework. The model struggles with problems that require tight coordination between tasks or frequent access to shared state.
Understanding these two phases and their interaction provides the foundation for applying MapReduce to E2E testing. The next section maps this general paradigm directly onto the specific challenges of running tests at scale.
The E2E Test MapReduce Architecture: A Conceptual Overview
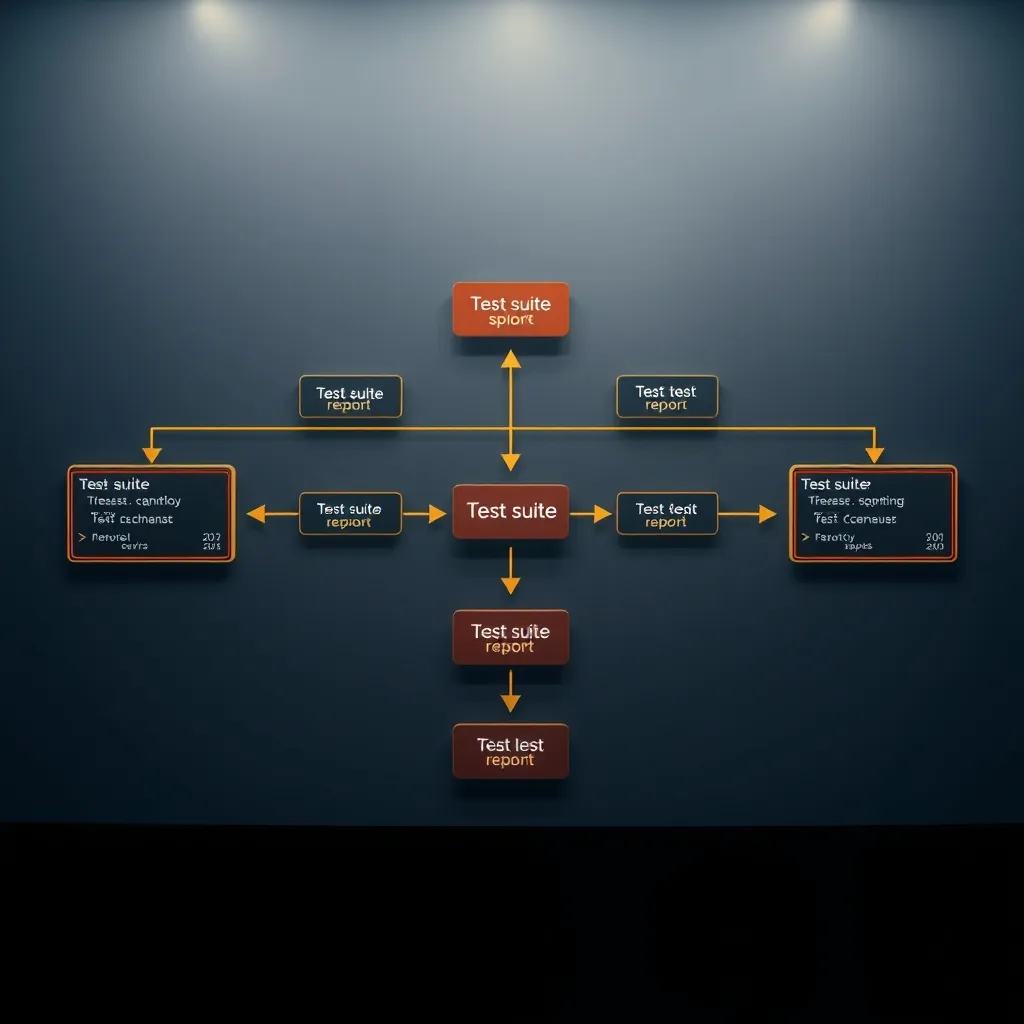
The MapReduce paradigm translates directly into E2E testing. Instead of processing data, it processes test scenarios. The same split-process-combine pattern applies, but the inputs and outputs change to fit the testing domain.
A standard E2E test suite runs scenarios sequentially. Each test waits for the previous one to finish before starting. With hundreds or thousands of scenarios, this sequential approach creates a bottleneck. A 10-minute test suite becomes a 10-hour ordeal when multiplied across environments and configurations.
The E2E Test MapReduce Architecture breaks this bottleneck. It treats the entire test suite as a large input dataset. The Map phase splits this dataset into independent test scenarios. Each scenario runs on its own worker node, container, or virtual machine. The system executes all scenarios in parallel, leveraging the full capacity of the available infrastructure.
Each mapper receives one test scenario. The mapper sets up the test environment, executes the test steps, captures results, and tears down the environment. The mapper outputs a key-value pair where the key identifies the test case and the value contains the test result data. This data includes pass/fail status, execution time, screenshots, and log snippets.
The Reduce phase collects all these key-value pairs from the completed mappers. It aggregates the results into a unified test report. The reducer calculates summary statistics: total tests run, passed, failed, and skipped. It groups failures by error type and identifies flaky tests that pass inconsistently.
The architecture introduces three critical abstractions that make this work in practice.
Test Partitioning determines how the system splits the test suite into mappable units. Simple partitioning assigns one test scenario per mapper. Advanced partitioning considers test dependencies, data requirements, and execution time to create balanced workloads.
Result Serialization defines how mappers encode their output for transmission to the reducer. JSON and Protocol Buffers serve as common formats. The serialization must include enough context for the reducer to produce meaningful aggregate reports without requiring access to the original test environment.
Fault Isolation ensures that a failing mapper does not corrupt the entire test run. The framework marks failed mappers as incomplete and continues processing the remaining scenarios. The reducer handles partial results gracefully, reporting both the completed and failed portions of the test suite.
This architecture transforms E2E testing from a sequential bottleneck into a parallel processing pipeline. The next section examines the specific responsibilities of the Mapper and Reducer components in more detail, including how they handle setup, execution, and teardown phases for each test scenario.
Key Components: Mapper and Reducer in Testing Context
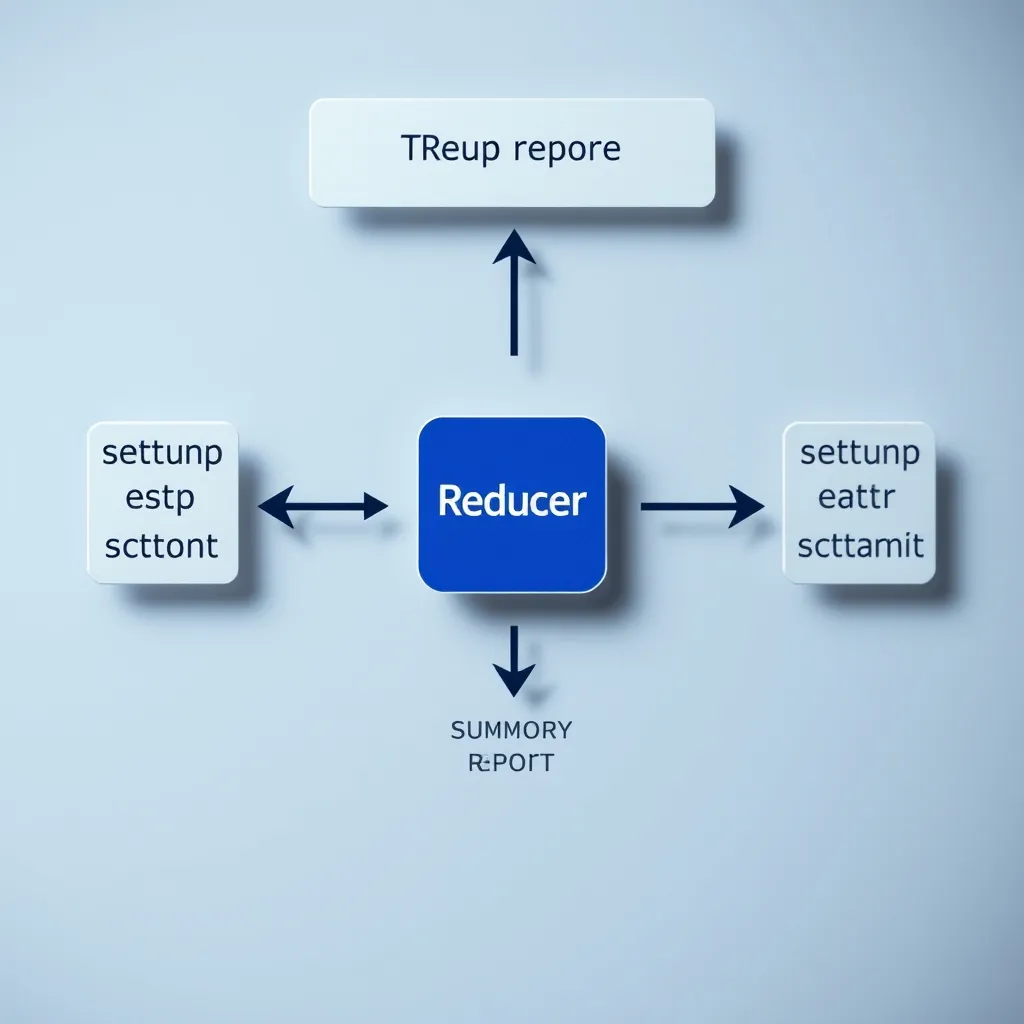
The Mapper and Reducer form the operational core of this architecture. Each component has distinct responsibilities that mirror their data processing counterparts but operate on test scenarios instead of data records.
The Mapper: Test Execution Engine
A mapper receives one test scenario as input. Its job is to execute that scenario from start to finish and produce a structured result. The mapper lifecycle follows three phases.
Setup Phase: The mapper prepares the test environment. This includes spinning up a clean database instance, seeding test data, configuring environment variables, and initializing browser drivers for UI tests. The mapper must ensure complete isolation from other mappers running in parallel. Shared state between scenarios defeats the purpose of parallel execution.
Execution Phase: The mapper runs the test steps in sequence. It interacts with the application under test, asserts expected behaviors, and captures timing data for each step. The mapper logs failures with stack traces and screenshots at the point of failure. It does not stop on the first failure. A well-designed mapper continues executing independent assertions to collect maximum diagnostic information.
Teardown Phase: The mapper cleans up all resources it created. It drops test databases, closes browser windows, removes temporary files, and releases API connections. Proper teardown prevents resource leaks that would degrade performance across multiple test runs.
The mapper outputs a key-value pair. The key is a unique test identifier, often the test class name and method. The value is a serialized result object containing pass/fail status, execution duration, error messages, and diagnostic artifacts. This output travels to the reducer through a distributed queue or intermediate storage layer.
The Reducer: Result Aggregator
The reducer collects all mapper outputs and synthesizes them into actionable intelligence. It operates after all mappers complete or after a configurable timeout for straggling mappers.
Result Collection: The reducer reads key-value pairs from the distributed queue. It groups results by test suite, test category, or custom tags defined in the test metadata. This grouping enables the reducer to produce reports at multiple granularity levels.
Aggregation Logic: The reducer calculates summary statistics. It counts total tests, passed tests, failed tests, and skipped tests. It computes execution time percentiles to identify slow scenarios. The reducer also detects flaky tests by comparing results across multiple runs and flagging tests that change status inconsistently.
Report Generation: The reducer formats the aggregated data into a structured report. Common formats include JUnit XML for CI tool integration, HTML dashboards for human review, and JSON for programmatic consumption. The report includes both high-level pass/fail status and drill-down details for each failed test.
Test Data Partitioning and Assignment
Partitioning determines how the system assigns test scenarios to mappers. The partitioning strategy directly impacts execution time and resource utilization.
Simple Round-Robin: The framework assigns scenarios to mappers in a circular fashion. This approach works well when all scenarios have similar execution times. It requires no analysis of test characteristics.
Time-Based Partitioning: The system analyzes historical execution times for each scenario. It groups scenarios with similar durations together. This prevents fast scenarios from waiting on slow ones and reduces overall wall-clock time.
Dependency-Aware Partitioning: Some test scenarios depend on results from other scenarios. The partitioner must honor these dependencies by either running dependent scenarios in the same mapper or scheduling them sequentially after the prerequisite mapper completes. Ignoring dependencies leads to false failures and wasted debugging effort.
The assignment mechanism uses a coordinator service that maintains a queue of unassigned scenarios. Each mapper requests a scenario from the queue when it becomes idle. This pull-based model handles mapper failures gracefully. If a mapper crashes mid-execution, the coordinator detects the timeout and reassigns the scenario to a different mapper.
This component design creates a robust foundation for parallel test execution. The mapper handles the heavy lifting of test execution in isolation. The reducer transforms raw results into meaningful reports. The partitioner ensures efficient resource utilization across the cluster.
Data Flow and Parallelism in E2E Test MapReduce

The data flow in an E2E Test MapReduce architecture follows a structured pipeline. Understanding this flow reveals how parallelism reduces execution time from hours to minutes for large test suites.
The Input Stage: Test Scenario Distribution
The pipeline starts with a test suite containing hundreds or thousands of scenarios. A coordinator service reads the suite definition and breaks it into individual test units. Each unit represents one independent test scenario with its own setup, execution steps, and teardown.
The coordinator assigns these units to the input queue. The queue acts as a buffer that decouples test preparation from execution. This design allows the coordinator to prepare scenarios while mappers execute previously assigned work. The queue depth determines how many scenarios wait for processing at any moment.
The Map Phase: Parallel Execution
Multiple mapper processes read from the input queue simultaneously. Each mapper picks one scenario, executes it, and writes the result to an intermediate storage layer. The number of parallel mappers depends on available compute resources. A typical setup scales from 10 to 100 mappers running concurrently.
Each mapper produces an intermediate key-value pair. The key contains the test identifier and optional grouping tags. The value holds the complete test result including pass/fail status, duration, error details, and diagnostic artifacts. These pairs land in a distributed file system or in-memory store accessible to all reducers.
The map phase completes when every scenario in the input queue has been processed. Straggling mappers that take significantly longer than average delay the overall completion time. The architecture handles this by setting a timeout and treating overdue mappers as failed, then reassigning their scenarios to faster mappers.
The Shuffle and Sort Stage: Organizing Results
Between the map and reduce phases lies a critical step called shuffle and sort. This stage collects all intermediate key-value pairs from the mappers and organizes them by key. The system groups pairs with the same key together, ensuring that a single reducer receives all results for a given test identifier or tag group.
The shuffle process transfers data across the network. Mappers push their results to a central location, or reducers pull results from mapper output locations. The sort operation orders the grouped pairs, typically by key in lexicographic order. This ordering enables the reducer to process results sequentially without random access.
Network bandwidth becomes a bottleneck during shuffle when many mappers transfer large result artifacts simultaneously. Compression and batching reduce the data volume. The architecture also supports partial aggregation during shuffle, where intermediate reducers combine results before sending them to the final reducer.
The Reduce Phase: Aggregation and Reporting
The reducer receives grouped key-value pairs from the shuffle stage. It processes each group independently, applying aggregation logic to produce a single output per group. For E2E testing, the reducer calculates summary statistics for each test suite, category, or tag.
The reducer counts passed and failed tests within each group. It computes execution time statistics including minimum, maximum, average, and percentile values. It identifies tests that failed with specific error patterns and groups them for easier debugging. The reducer also flags tests that produced inconsistent results across multiple runs, indicating flakiness.
The reducer writes its output to a final report. This report contains both high-level summaries and detailed breakdowns. The format matches the requirements of downstream tools. JUnit XML works well for CI integration. HTML dashboards provide human-readable views. JSON enables programmatic analysis and archival.
Parallelism Gains and Performance Impact
The parallel execution model directly reduces wall-clock time. A test suite requiring 10 hours to run sequentially can complete in 10 minutes with 60 parallel mappers, assuming perfect scaling. Real-world scaling approaches 80-90% efficiency due to overhead from setup, teardown, and data transfer.
The map phase benefits most from parallelism because test scenarios execute independently. The reduce phase benefits less because it processes aggregated results rather than raw test execution. The shuffle stage adds fixed overhead that does not scale with additional resources.
Resource contention limits parallelism gains. Too many mappers competing for CPU, memory, or database connections causes performance degradation. The optimal parallelism level depends on the application under test and the infrastructure capacity. Monitoring mapper utilization helps identify the sweet spot where adding more mappers no longer reduces execution time.
Handling Test Data Consistency Across Distributed Mappers
Distributed execution creates a fundamental tension. Each mapper needs isolated test data to avoid interference. But the application under test often expects a shared database state. Resolving this tension requires deliberate strategies for data consistency.
The Core Problem: Shared State Conflicts
Two mappers running the same test scenario simultaneously can collide. Both attempt to create the same user account. Both try to book the same resource. Both expect exclusive access to a configuration flag. These collisions produce false failures that waste debugging time and erode trust in the test suite.
The severity depends on the application domain. E-commerce systems with inventory constraints suffer frequent collisions. Content management systems with concurrent editing face similar issues. Read-only applications experience fewer conflicts but still require consistent baseline data for accurate assertions.
Data consistency failures manifest as intermittent test results. A test passes when run alone but fails when executed in parallel. This flakiness is the most destructive outcome in automated testing. Teams lose confidence in the pipeline and start ignoring failures, defeating the purpose of continuous integration.
Strategy One: Database Snapshots and Cloning
The most reliable approach creates an independent database copy for each mapper. The coordinator takes a snapshot of a known good database state before the test run begins. Each mapper receives a clone of this snapshot at the start of its execution.
Database cloning technologies make this practical. PostgreSQL supports template databases that copy quickly. MySQL offers clone plugins for physical replication. Cloud databases provide snapshot APIs that create point-in-time copies in seconds.
The trade-off involves storage and time. Cloning a 10-gigabyte database for 50 mappers requires 500 gigabytes of storage. The cloning operation adds startup latency. Teams mitigate this by pre-provisioning clones in a pool and recycling them across test runs. A pool of 20 clones can serve 100 mappers sequentially with minimal overhead.
Snapshot-based isolation guarantees that each mapper sees the exact same data state. No mapper can corrupt another mapper’s data. The approach works well for applications with complex relational schemas and interdependent tables.
Strategy Two: Idempotent Test Setup and Teardown
Idempotent setup eliminates the need for isolation. Each mapper’s test scenario creates its own data and cleans up afterward. The setup logic checks whether required data already exists before creating it. The teardown logic removes only the data created by that specific scenario.
This strategy works best with unique identifiers. Each test generates a random or timestamped suffix for user names, order numbers, and resource IDs. Two mappers creating user accounts with different IDs never collide because the accounts are distinct database rows.
The challenge lies in cleanup. A mapper that crashes mid-execution leaves orphaned data. Subsequent test runs accumulate garbage that eventually degrades performance. A garbage collection process must run periodically to remove orphaned records older than a threshold, typically one hour.
Idempotent setup reduces infrastructure complexity. No database cloning or snapshot management is required. The approach scales to hundreds of mappers without proportional storage growth. The cost is increased test complexity and the need for robust cleanup mechanisms.
Strategy Three: Namespacing and Partitioning
Namespacing divides the shared state into logical partitions. Each mapper receives a namespace identifier. All operations within that mapper use the namespace to scope their data access. The application must support namespace filtering in queries and mutations.
Multi-tenant applications already implement this pattern. Each tenant sees only its own data. The test framework assigns each mapper a virtual tenant ID. The application’s existing tenant isolation mechanisms prevent cross-mapper interference.
Partitioning extends this idea to database shards. Each mapper connects to a dedicated shard containing only its test data. Shard assignment happens at mapper startup. The coordinator maintains a mapping of mapper IDs to shard IDs for debugging and cleanup.
Namespacing requires application changes. The application must accept and propagate namespace identifiers through all layers. Legacy applications with hardcoded queries or global state cannot use this strategy without significant refactoring.
Strategy Four: Deterministic Data Generation
Deterministic generation produces consistent data without external dependencies. Each mapper receives a seed value derived from its test identifier. The test setup uses this seed to generate the same data every time, regardless of execution order or parallelism level.
This strategy eliminates the need for shared databases entirely. Mappers can use in-memory databases, mock objects, or lightweight containers. The generated data matches the expected patterns for assertions. The deterministic nature ensures reproducible results across runs.
The limitation is realism. Generated data often lacks the complexity and edge cases present in production databases. Tests that depend on specific data distributions or historical records cannot rely solely on generation. A hybrid approach uses generated data for most tests and snapshot data for a subset of critical scenarios.
Choosing the Right Strategy
The best strategy depends on your application architecture and testing goals. Applications with complex relational data benefit from snapshots. Applications with simple data models work well with idempotent setup. Multi-tenant applications leverage existing namespacing. Stateless applications can use deterministic generation.
Most teams combine multiple strategies. They use snapshots for integration tests that touch the database. They use idempotent setup for API tests that create and delete resources. They use deterministic generation for unit tests and contract tests that mock external dependencies.
Monitor data consistency failures as a key quality metric. A rising trend in data-related test failures indicates that your current strategy is breaking under the parallelism load. Revisit the strategy before the flakiness erodes team confidence in the distributed test pipeline.
Performance Considerations: Network Latency and Data Skew

Distributed execution introduces two performance killers that rarely surface in sequential test runs. Network latency adds unpredictable delays between test steps. Data skew creates bottlenecks where some mappers finish quickly while others labor for minutes. Both problems undermine the scaling benefits of the MapReduce approach.
Network Latency: The Hidden Variable
Every mapper communicates with shared infrastructure. Database queries travel across the network. API calls to the application under test traverse switches and routers. File operations on distributed storage systems require network round trips. Each hop adds microseconds or milliseconds that compound across thousands of test steps.
Latency variability is the real problem. A database query that takes 2 milliseconds in one run can take 200 milliseconds in the next run due to network congestion. Tests that assert on response times become flaky. Tests that depend on strict execution ordering fail intermittently.
The impact scales with test complexity. A single-page application test that makes 50 API calls suffers 50 times the latency impact. An e-commerce checkout flow that touches inventory, payment, and shipping services faces cumulative delays across each service boundary.
Mitigation starts with co-location. Deploy the test infrastructure in the same availability zone as the application and database. Reduce the physical distance between components. Use dedicated network paths instead of shared internet connections. Every millisecond of latency reduction compounds across the entire test suite.
Timeouts require careful calibration. Set timeouts tight enough to catch real failures but loose enough to accommodate latency spikes. A timeout of 5 seconds might work for 99 percent of test steps but fail on the remaining 1 percent during peak network load. Implement exponential backoff with retries for transient network failures.
Network monitoring becomes essential. Instrument each mapper to record network round-trip times for every external call. Aggregate these metrics across all mappers to identify latency hotspots. A sudden increase in average latency across all mappers suggests infrastructure degradation. A spike in only one mapper suggests a network path issue.
Data Skew: The Load Balancing Trap
Data skew occurs when test scenarios distribute unevenly across mappers. One mapper receives 50 test scenarios while another receives 5. The overloaded mapper becomes the bottleneck. The entire test run waits for that single mapper to finish.
Skew arises from multiple sources. Test scenarios with different execution times get grouped together. A mapper handling 10 login tests finishes quickly. A mapper handling 10 checkout tests with payment gateway calls takes five times longer. The test suite designer assumed all scenarios were equal, but reality disagrees.
Data dependencies create another skew pattern. A mapper that waits for external system responses sits idle while other mappers complete. A mapper that processes large data files consumes CPU and I/O while others finish in seconds. The coordinator has no visibility into these internal differences.
Partitioning strategies directly affect skew. Hash-based partitioning distributes scenarios by test ID modulo the number of mappers. This works well when test IDs are evenly distributed. It fails catastrophically when test IDs cluster around certain values. Range-based partitioning distributes scenarios by alphabetical order. This creates predictable skew when scenario names follow patterns like test_001 through test_100.
Mitigation Techniques for Data Skew
Dynamic partitioning adapts to actual execution times. The coordinator starts with a small batch of scenarios per mapper. As mappers finish their initial batch, the coordinator assigns additional scenarios. Mappers that execute quickly receive more work. Slow mappers receive less. The total execution time approaches the sum of all scenario times divided by the number of mappers.
This technique requires a coordinator that can communicate with mappers during execution. The overhead of this communication must be smaller than the skew reduction benefits. For test suites with hundreds of scenarios, the benefit far exceeds the cost.
Speculative execution provides a second mitigation layer. The coordinator assigns the same scenario to multiple mappers simultaneously. The first mapper to complete returns the result. The coordinator cancels the duplicate mappers. This technique reduces the impact of a single slow mapper on the overall execution time.
The trade-off involves wasted resources. Running the same scenario on three mappers consumes three times the CPU and memory. The cost is acceptable when the scenario is critical and the parallelism level is low. The cost becomes prohibitive when hundreds of scenarios run with speculative execution.
Profile your test scenarios to identify skew sources. Measure the execution time of each scenario under controlled conditions. Group scenarios by execution time ranges. Assign similar-duration scenarios to the same mapper. This reduces the variance within each mapper and makes the overall distribution more predictable.
Monitoring and Metrics for Performance
Track mapper completion times as a primary metric. A histogram of completion times reveals skew immediately. A flat distribution with all mappers finishing within 10 percent of each other indicates good load balance. A long tail with one mapper taking twice as long as the median indicates skew.
Record network latency percentiles for each external service. The 50th percentile shows typical performance. The 99th percentile reveals worst-case latency. A widening gap between these percentiles indicates increasing network variability that will eventually cause timeouts.
Correlate performance metrics with test results. A test that fails during a latency spike is likely a flaky test, not a real regression. Tag these failures differently in your reporting system. Track the flaky failure rate separately from the real failure rate to maintain team trust in the test results.
Set performance budgets for your distributed test pipeline. Define maximum acceptable execution time for the full suite. Define maximum acceptable variance across mappers. When these budgets are exceeded, investigate the root cause before adding more test scenarios or mappers. Scaling without performance monitoring amplifies existing problems rather than solving them.
Cost Implications and Resource Optimization in Cloud-Based Setups

Cloud-based MapReduce execution shifts testing costs from capital expenditure to operational expenditure. Every test run consumes compute resources, storage, and network bandwidth. Without careful management, these costs can exceed the savings gained from faster execution times. Understanding the cost drivers and optimization strategies is essential for sustainable implementation.
Compute Costs: The Dominant Factor
Compute resources account for the largest portion of cloud testing costs. Each mapper runs on a virtual machine instance. Each instance incurs charges based on its type, size, and running time. A cluster of 20 m2.xlarge instances running for one hour costs significantly more than a single instance running for 20 hours.
Instance selection directly impacts cost. General-purpose instances provide balanced compute and memory. Compute-optimized instances handle CPU-intensive test scenarios. Memory-optimized instances suit tests that load large datasets. Choosing the wrong instance type wastes money on unused capacity.
Idle time creates hidden costs. A cluster that remains running between test runs accumulates charges without delivering value. A cluster that starts up, runs tests, and shuts down within minutes only pays for active compute time. The startup and shutdown overhead must be factored into the total cost calculation.
Minimum instance counts drive baseline costs. Many cloud services require a minimum number of instances for cluster formation. A five-node minimum cluster costs five times the per-instance rate even when the test suite only needs three mappers. Evaluate whether the test suite volume justifies the minimum instance requirement.
Storage Costs: Persistent vs. Ephemeral
Storage costs arise from test data, logs, and results. Each mapper generates logs during execution. Test scenarios may require input datasets stored in cloud storage. Test results accumulate over time. Each storage tier carries different cost profiles.
Ephemeral storage comes with the compute instances. This storage disappears when the instance terminates. It incurs no additional cost beyond the instance charge. Use ephemeral storage for temporary test data, intermediate results, and mapper logs that do not need long-term retention.
Persistent storage in services like Amazon S3 or Google Cloud Storage retains data indefinitely. Input test datasets stored here incur monthly storage charges. Test results stored here accumulate costs over time. Implement lifecycle policies that transition older test results to cheaper storage tiers or delete them after a retention period.
Log aggregation adds storage costs. A test suite running 1000 scenarios generates megabytes of log data per run. Over weeks and months, this data grows into gigabytes and terabytes. Archive logs after 30 days to cold storage. Delete logs older than 90 days unless compliance requirements dictate otherwise.
Data Transfer Costs: The Hidden Expense
Data transfer costs surprise many teams adopting cloud-based testing. Moving data between availability zones, regions, or internet boundaries incurs charges. Test scenarios that transfer large datasets between mappers and the application under test accumulate these costs.
Inter-availability-zone transfer costs apply when mappers run in one zone and the application runs in another. Keep all components within the same zone to eliminate these charges. This constraint limits fault tolerance but reduces cost.
Internet egress costs apply when test data leaves the cloud provider’s network. Tests that validate external APIs or third-party services incur these charges. Minimize external calls during test execution. Cache external responses where possible to reduce repeated data transfer.
Data transfer between mappers and the coordinator also carries costs. The coordinator sends test scenarios to mappers and receives results. Each message adds to the data transfer total. Optimize message sizes by sending scenario identifiers instead of full scenario definitions. Compress result payloads before transmission.
Resource Optimization Strategies
Auto-scaling adjusts cluster size based on workload. The cluster starts with a minimum number of instances. As the test suite runs, the auto-scaling policy adds instances when queue depth exceeds thresholds. When the test suite completes, the cluster scales down to the minimum. This approach matches resource consumption to actual demand.
Implement auto-scaling with careful threshold selection. A queue depth threshold of 10 scenarios triggers scale-up when more than 10 scenarios wait for execution. A scale-down threshold of 5 scenarios triggers removal when fewer than 5 scenarios wait. Test these thresholds with your actual test suite to avoid oscillation.
Spot instances offer significant cost savings compared to on-demand instances. Cloud providers offer unused capacity at discounts of 60 to 90 percent. The trade-off involves interruption risk. Spot instances can be terminated with two minutes notice when the provider reclaims the capacity.
Design your test pipeline to handle spot instance interruptions. Save test state periodically so interrupted mappers can resume from the last checkpoint. Use spot instances for mappers that run short test scenarios. Reserve on-demand instances for the coordinator and critical mappers that must not be interrupted.
Instance pooling combines multiple instance types in a single cluster. Use a mix of spot and on-demand instances to balance cost and reliability. Start with spot instances for the majority of mappers. Fall back to on-demand instances when spot capacity is unavailable. This approach captures cost savings while maintaining execution reliability.
Cost Monitoring and Budgeting
Set cost budgets for your testing pipeline. Define monthly spending limits for compute, storage, and data transfer. Configure alerts that notify the team when spending approaches 80 percent of the budget. This early warning allows investigation before costs exceed expectations.
Tag all resources used by the testing pipeline. Apply tags for environment, team, project, and test suite. Cloud cost management tools aggregate spending by tag. This visibility shows which test suites consume the most resources and where optimization efforts should focus.
Track cost per test run as a key metric. Divide total cloud costs by the number of test runs in a period. A decreasing cost per run indicates successful optimization. An increasing cost per run signals that resource consumption grows faster than test suite volume.
Compare cost against time savings. A test suite that runs in 10 minutes on a 20-node cluster costs more than a suite that runs in 30 minutes on a 5-node cluster. Calculate the value of developer time saved against the additional compute cost. The optimal balance depends on your team size, release frequency, and cost tolerance.
Cost Optimization Checklist
- Use ephemeral storage for temporary test data and logs
- Implement lifecycle policies for persistent storage
- Keep all components in the same availability zone
- Minimize external API calls during test execution
- Compress data transfer payloads between coordinator and mappers
- Configure auto-scaling with appropriate thresholds
- Use spot instances for interrupt-tolerant mappers
- Implement checkpointing for spot instance interruptions
- Set cost budgets and alerts for the testing pipeline
- Tag all resources for cost allocation and tracking
- Track cost per test run as a performance metric
- Review instance types and sizes for cost efficiency
Cloud-based MapReduce testing delivers speed and scalability. The costs are real but manageable. Apply these optimization strategies to keep spending under control while reaping the benefits of distributed execution. The team that monitors costs as carefully as test results builds a sustainable testing practice.
Step-by-Step Tutorial: Building a Minimal E2E Test MapReduce Pipeline

This tutorial walks through building a working E2E test pipeline using Python and the MapReduce pattern. The pipeline runs test scenarios in parallel, collects results, and aggregates them into a pass-fail summary. You can adapt this minimal implementation to your own test framework and infrastructure.
Prerequisites and Setup
You need Python 3.8 or later installed on your machine. The pipeline uses only standard library modules, so no external dependencies are required. Create a project directory and navigate into it.
mkdir e2e-mapreduce-tutorial
cd e2e-mapreduce-tutorial
Defining the Test Scenario Format
Each test scenario is a JSON object stored in a text file. One scenario per line. This format allows easy splitting and distribution across mappers.
# test_scenarios.txt
{"id": "001", "url": "https://example.com/login", "expected_status": 200}
{"id": "002", "url": "https://example.com/dashboard", "expected_status": 200}
{"id": "003", "url": "https://example.com/settings", "expected_status": 403}
{"id": "004", "url": "https://example.com/logout", "expected_status": 200}
Each scenario includes a unique identifier, the endpoint to test, and the expected HTTP status code. You can extend this format with additional fields like request headers, payload data, or authentication tokens.
Building the Mapper Function
The mapper reads one scenario, executes the test, and emits a key-value pair. The key is the scenario ID. The value contains the pass-fail result and any error details.
# mapper.py
import json
import sys
import urllib.request
import urllib.error

def mapper():
    for line in sys.stdin:
        line = line.strip()
        if not line:
            continue
        scenario = json.loads(line)
        scenario_id = scenario["id"]
        url = scenario["url"]
        expected_status = scenario["expected_status"]
        try:
            response = urllib.request.urlopen(url, timeout=10)
            actual_status = response.getcode()
            if actual_status == expected_status:
                result = "pass"
                error = ""
            else:
                result = "fail"
                error = f"Expected {expected_status}, got {actual_status}"
        except urllib.error.HTTPError as e:
            actual_status = e.code
            if actual_status == expected_status:
                result = "pass"
                error = ""
            else:
                result = "fail"
                error = f"Expected {expected_status}, got {actual_status}"
        except Exception as e:
            result = "fail"
            error = str(e)
        output = {"id": scenario_id, "result": result, "error": error}
        print(json.dumps(output))

if __name__ == "__main__":
    mapper()
The mapper reads from standard input. This design allows easy piping from file splitting commands. Each scenario is processed independently. A timeout prevents hanging on slow endpoints.
Building the Reducer Function
The reducer collects all mapper outputs and aggregates them into a summary. It counts total scenarios, passes, fails, and lists the failed scenario IDs with their errors.
# reducer.py
import json
import sys

def reducer():
    total = 0
    passed = 0
    failed = 0
    failures = []
    for line in sys.stdin:
        line = line.strip()
        if not line:
            continue
        result = json.loads(line)
        total += 1
        if result["result"] == "pass":
            passed += 1
        else:
            failed += 1
            failures.append({"id": result["id"], "error": result["error"]})
    summary = {
        "total": total,
        "passed": passed,
        "failed": failed,
        "failures": failures
    }
    print(json.dumps(summary, indent=2))

if __name__ == "__main__":
    reducer()
The reducer reads from standard input. This design allows piping mapper output directly into the reducer. The summary output provides a clear pass-fail overview for integration with CI/CD tools.
Running the Pipeline Locally
Test the pipeline on a single machine first. Split the test scenarios file into chunks and process each chunk through a mapper. Then pipe all mapper outputs into the reducer.
# Split scenarios into chunks (2 scenarios per chunk)
split -l 2 test_scenarios.txt chunk_

# Run mapper on each chunk and collect outputs
for chunk in chunk_*; do
    python mapper.py < "$chunk" > "${chunk}_out"
done

# Combine mapper outputs and run reducer
cat chunk_*_out | python reducer.py
This approach simulates distributed execution. Each chunk represents a mapper task. The reducer aggregates results from all mappers. The final output shows the test summary.
Parallel Execution with Multiprocessing
Replace the sequential loop with Python’s multiprocessing module for true parallel execution on a single machine. This approach demonstrates the MapReduce pattern without requiring a cluster.
# run_pipeline.py
import json
import multiprocessing
import os
import subprocess
import sys

def run_mapper(chunk_file):
    with open(chunk_file, "r") as f:
        input_data = f.read()
    proc = subprocess.run(
        ["python", "mapper.py"],
        input=input_data,
        capture_output=True,
        text=True
    )
    return proc.stdout

def main():
    # Split scenarios into chunks
    scenario_file = "test_scenarios.txt"
    num_mappers = 4
    with open(scenario_file, "r") as f:
        lines = f.readlines()
    chunk_size = max(1, len(lines) // num_mappers)
    chunks = [lines[i:i + chunk_size] for i in range(0, len(lines), chunk_size)]
    chunk_files = []
    for i, chunk in enumerate(chunks):
        chunk_file = f"chunk_{i}.txt"
        with open(chunk_file, "w") as f:
            f.writelines(chunk)
        chunk_files.append(chunk_file)
    # Run mappers in parallel
    with multiprocessing.Pool(num_mappers) as pool:
        mapper_outputs = pool.map(run_mapper, chunk_files)
    # Combine mapper outputs and run reducer
    combined = "".join(mapper_outputs)
    proc = subprocess.run(
        ["python", "reducer.py"],
        input=combined,
        capture_output=True,
        text=True
    )
    print(proc.stdout)
    # Cleanup chunk files
    for chunk_file in chunk_files:
        os.remove(chunk_file)

if __name__ == "__main__":
    main()
Run the pipeline with a single command.
python run_pipeline.pyThe output shows the aggregated test results. This implementation handles the Map phase through parallel mapper execution and the Reduce phase through the reducer aggregation.
Extending to a Distributed Cluster
Replace the local multiprocessing pool with a distributed task queue like Celery or a cloud service like AWS Lambda. Each mapper becomes an independent task. The reducer runs after all mappers complete. The core mapper and reducer logic remains unchanged.
For Apache Spark integration, wrap the mapper and reducer as Spark functions. The Spark framework handles data partitioning, task distribution, and fault tolerance automatically.
# spark_pipeline.py (conceptual)
from pyspark import SparkContext

sc = SparkContext("local", "E2ETestPipeline")
scenarios = sc.textFile("test_scenarios.txt")
mapper_results = scenarios.map(mapper_function)
summary = mapper_results.reduceByKey(aggregate_results)
summary.saveAsTextFile("test_summary")
The mapper function processes each line independently. The reduceByKey operation aggregates results by scenario ID or by pass-fail status. Spark handles data shuffling and task scheduling across the cluster.
Verifying the Pipeline Output
A successful run produces output similar to this example.
{
  "total": 4,
  "passed": 3,
  "failed": 1,
  "failures": [
    {
      "id": "003",
      "error": "Expected 403, got 200"
    }
  ]
}
The summary shows one failed scenario with the specific error. This output format integrates easily with CI/CD pipeline status checks. A non-zero failed count triggers a pipeline failure.
Troubleshooting Common Issues
Mapper processes that hang indefinitely waste resources. Add a timeout wrapper around the mapper execution in the pipeline script. Use Python’s signal module to kill mappers that exceed a configurable time limit.
Empty mapper outputs indicate that the input file format does not match the mapper expectations. Verify that each line contains valid JSON with the required fields. Check for trailing whitespace or empty lines in the input file.
Reducer errors often stem from malformed mapper output. Each mapper output line must be a valid JSON object. Add error handling in the reducer to skip or log invalid lines for debugging.
This minimal pipeline provides a working foundation. The mapper and reducer functions handle the core logic. The execution layer can scale from a single machine to a distributed cluster. Build on this foundation to match your testing requirements.
Integration with CI/CD Pipelines (Jenkins, GitLab CI, GitHub Actions)
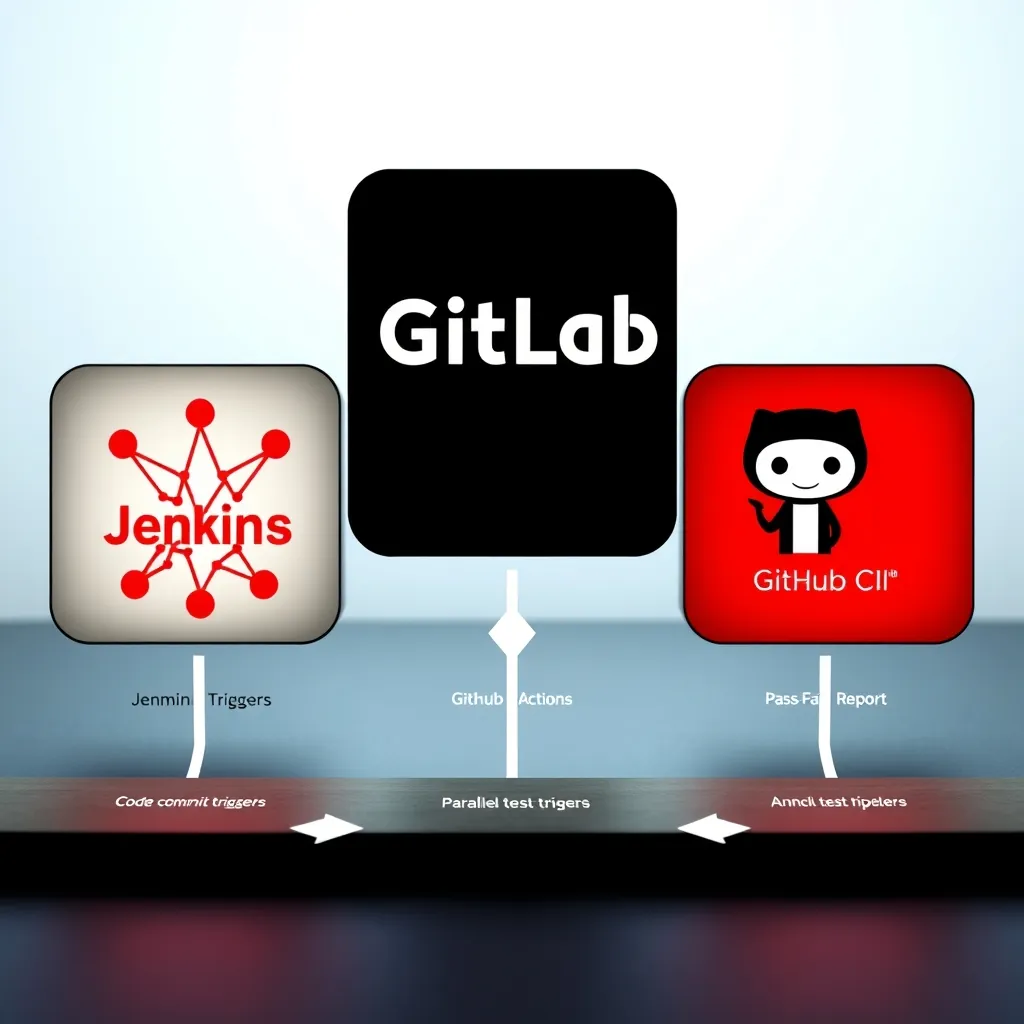
The MapReduce E2E test pipeline becomes most valuable when triggered automatically on every code change. CI/CD tools provide the orchestration layer that splits test scenarios, distributes mapper tasks, and collects results. Each platform requires a different configuration approach, but the core pipeline logic remains identical.
Jenkins Pipeline Configuration
Jenkins uses a Declarative Pipeline syntax defined in a Jenkinsfile. The pipeline checks out the repository, splits test scenarios into chunks, distributes mapper tasks across agents, and runs the reducer on the master node.
// Jenkinsfile
pipeline {
    agent any
    stages {
        stage('Prepare Test Scenarios') {
            steps {
                checkout scm
                sh 'split -l 10 test_scenarios.txt chunk_'
            }
        }
        stage('Distribute Mapper Tasks') {
            parallel {
                stage('Mapper 1') {
                    agent { label 'test-agent-1' }
                    steps {
                        sh 'python mapper.py < chunk_aa > chunk_aa_out'
                    }
                }
                stage('Mapper 2') {
                    agent { label 'test-agent-2' }
                    steps {
                        sh 'python mapper.py < chunk_ab > chunk_ab_out'
                    }
                }
                stage('Mapper 3') {
                    agent { label 'test-agent-3' }
                    steps {
                        sh 'python mapper.py < chunk_ac > chunk_ac_out'
                    }
                }
            }
        }
        stage('Aggregate Results') {
            steps {
                sh 'cat chunk_*_out | python reducer.py > summary.json'
                archiveArtifacts artifacts: 'summary.json'
            }
        }
    }
    post {
        always {
            sh 'rm -f chunk_*'
        }
    }
}
The parallel stage runs mapper tasks concurrently on separate Jenkins agents. Each agent processes one chunk of test scenarios. The aggregate stage runs on the master node and collects all mapper outputs. The post block cleans up temporary chunk files regardless of build outcome.
For dynamic agent allocation, use the matrix directive to spawn mapper tasks based on the number of chunks. This approach scales automatically with the size of the test suite.
GitLab CI Configuration
GitLab CI uses a .gitlab-ci.yml file with job definitions. Each mapper job runs as an independent CI job. The reducer job depends on all mapper jobs completing successfully.
# .gitlab-ci.yml
stages:
  - prepare
  - map
  - reduce

variables:
  SCENARIO_FILE: test_scenarios.txt
  CHUNK_SIZE: 10

prepare_scenarios:
  stage: prepare
  script:
    - split -l $CHUNK_SIZE $SCENARIO_FILE chunk_
    - for f in chunk_*; do echo $f; done > chunks.txt
  artifacts:
    paths:
      - chunk_*
    expire_in: 1 hour

mapper:
  stage: map
  parallel:
    matrix:
      - CHUNK: [chunk_aa, chunk_ab, chunk_ac, chunk_ad]
  script:
    - python mapper.py < $CHUNK > ${CHUNK}_out
  artifacts:
    paths:
      - ${CHUNK}_out
    expire_in: 1 hour

reducer:
  stage: reduce
  script:
    - cat chunk_*_out | python reducer.py > summary.json
  artifacts:
    paths:
      - summary.json
    expire_in: 1 week
  needs:
    - mapper
The prepare stage splits the scenario file and stores chunks as artifacts. The mapper stage runs in parallel with four jobs, each processing one chunk. The reducer stage collects all mapper outputs and produces the final summary. The needs keyword ensures the reducer waits for all mapper jobs to finish.
For dynamic chunk allocation, generate the parallel matrix from the chunks.txt file using a CI/CD variable or a custom script. GitLab CI supports dynamic child pipelines for fully automated scaling.
GitHub Actions Workflow
GitHub Actions uses a workflow YAML file stored in the .github/workflows directory. The workflow defines jobs that run on GitHub-hosted runners or self-hosted runners.
# .github/workflows/e2e-mapreduce.yml
name: E2E MapReduce Tests

on:
  push:
    branches: [main]
  pull_request:
    branches: [main]

jobs:
  prepare:
    runs-on: ubuntu-latest
    outputs:
      chunks: ${{ steps.split.outputs.chunks }}
    steps:
      - uses: actions/checkout@v3
      - id: split
        run: |
          split -l 10 test_scenarios.txt chunk_
          echo "chunks=$(ls chunk_* | jq -R -s -c 'split("\n")[:-1]')" >> $GITHUB_OUTPUT
      - uses: actions/upload-artifact@v3
        with:
          name: chunks
          path: chunk_*

  mapper:
    needs: prepare
    runs-on: ubuntu-latest
    strategy:
      matrix:
        chunk: ${{ fromJson(needs.prepare.outputs.chunks) }}
    steps:
      - uses: actions/download-artifact@v3
        with:
          name: chunks
      - run: python mapper.py < ${{ matrix.chunk }} > ${{ matrix.chunk }}_out
      - uses: actions/upload-artifact@v3
        with:
          name: mapper-outputs
          path: ${{ matrix.chunk }}_out

  reducer:
    needs: mapper
    runs-on: ubuntu-latest
    steps:
      - uses: actions/download-artifact@v3
        with:
          name: mapper-outputs
      - run: cat chunk_*_out | python reducer.py > summary.json
      - uses: actions/upload-artifact@v3
        with:
          name: summary
          path: summary.json
      - name: Check test results
        run: |
          FAILED=$(python -c "import json; print(json.load(open('summary.json'))['failed'])")
          if [ "$FAILED" -gt 0 ]; then exit 1; fi
The prepare job splits scenarios and outputs the list of chunk filenames as a JSON array. The mapper job uses a matrix strategy to run one job per chunk. The reducer job downloads all mapper outputs and runs the reducer. The final step checks the failed count and exits with a non-zero status if any tests failed, causing the workflow to fail.
GitHub Actions limits matrix jobs to 256 entries. For larger test suites, batch chunks into groups or use a custom script to distribute work across fewer mapper jobs.
Handling Secrets and Environment Variables
E2E tests often require API keys, database credentials, or authentication tokens. Store these values as CI/CD secrets and pass them to mapper jobs as environment variables.
# GitLab CI example with secrets
mapper:
  stage: map
  script:
    - export API_KEY=$API_KEY
    - python mapper.py < $CHUNK > ${CHUNK}_out
  secrets:
    API_KEY: API_KEY_VARIABLE
Each CI/CD platform provides a secrets manager. Jenkins uses the Credentials Binding plugin. GitLab CI uses CI/CD variables marked as masked. GitHub Actions uses repository secrets. Never hardcode secrets in configuration files or test scenarios.
Configuring Notifications and Alerts
Failed tests require immediate attention. Configure CI/CD notifications to alert the team when the reducer output shows a non-zero failed count.
Jenkins sends email notifications through the Email Extension plugin. GitLab CI integrates with Slack, Microsoft Teams, and email. GitHub Actions supports Slack notifications through third-party actions or custom webhook calls.
# GitHub Actions notification step
- name: Notify on failure
  if: failure()
  uses: slackapi/slack-github-action@v1.24.0
  with:
    payload: |
      {
        "text": "E2E tests failed on ${{ github.ref }}. Check summary artifact for details."
      }
  env:
    SLACK_WEBHOOK_URL: ${{ secrets.SLACK_WEBHOOK_URL }}
The notification includes a link to the workflow run and the summary artifact. This direct link saves debugging time by pointing engineers straight to the failed scenarios.
These CI/CD configurations turn the MapReduce E2E test pipeline from a local proof-of-concept into a production-ready automation system. The same mapper and reducer code runs unchanged across all three platforms. Only the orchestration layer differs. Choose the platform that matches your existing infrastructure and scale requirements.
Monitoring and Debugging Distributed E2E Tests

Distributed test execution introduces complexity that single-node testing avoids. A mapper task may fail while others succeed. Network partitions can cause timeouts. Data skew can overload one mapper while others sit idle. Without proper monitoring and debugging tools, finding the root cause of a failure becomes a scavenger hunt across dozens of log files.
Centralized Log Aggregation
Every mapper and the reducer produce log output. Collecting these logs into a single location is the first step toward effective debugging. Tools like the ELK stack (Elasticsearch, Logstash, Kibana), Grafana Loki, or Datadog provide centralized log aggregation.
Configure each mapper job to write structured logs in JSON format. Include the chunk identifier, scenario name, timestamp, and error context in every log entry.
# Python mapper with structured logging
import logging
import json

class StructuredFormatter(logging.Formatter):
    def format(self, record):
        log_entry = {
            "timestamp": self.formatTime(record),
            "level": record.levelname,
            "mapper_id": getattr(record, "mapper_id", "unknown"),
            "scenario": getattr(record, "scenario", "unknown"),
            "message": record.getMessage(),
        }
        if record.exc_info:
            log_entry["traceback"] = self.formatException(record.exc_info)
        return json.dumps(log_entry)

logger = logging.getLogger("mapper")
handler = logging.StreamHandler()
handler.setFormatter(StructuredFormatter())
logger.addHandler(handler)
logger.setLevel(logging.INFO)
Each CI/CD platform supports log streaming. Jenkins streams logs to the console output. GitLab CI stores logs per job. GitHub Actions provides real-time log viewing. For long-running test suites, stream logs to an external aggregator rather than relying on CI/CD log retention limits.
Metrics and Dashboards
Logs tell you what happened. Metrics tell you how the system performed. Track these key metrics for every MapReduce test run:
- Mapper execution time per chunk to detect data skew or slow scenarios.
- Reducer execution time to identify bottlenecks in aggregation logic.
- Pass/fail counts per mapper to spot problematic chunks.
- Chunk size distribution to ensure even workload splitting.
- Network latency between mapper nodes and the reducer.
- Resource utilization (CPU, memory, disk I/O) per mapper node.
Export these metrics to Prometheus or Datadog and build a Grafana dashboard. A well-designed dashboard shows the overall test status at a glance. Green means all mappers passed. Red highlights the specific mapper that failed. Drill down into the failed mapper to see its execution time and resource usage.
# Example metric export from mapper
from prometheus_client import Counter, Histogram, start_http_server

TEST_PASSED = Counter("test_passed_total", "Total passed tests", ["scenario"])
TEST_FAILED = Counter("test_failed_total", "Total failed tests", ["scenario"])
MAPPER_DURATION = Histogram("mapper_duration_seconds", "Mapper execution time", ["chunk_id"])

def run_scenario(scenario):
    with MAPPER_DURATION.labels(chunk_id=CHUNK_ID).time():
        try:
            execute_test(scenario)
            TEST_PASSED.labels(scenario=scenario).inc()
        except Exception as e:
            TEST_FAILED.labels(scenario=scenario).inc()
            raise
Debugging Partial Failures
Partial failures occur when some mappers succeed and others fail. The reducer must handle this gracefully. Implement a strategy where the reducer marks the overall run as failed but preserves successful mapper outputs for analysis.
Include a status field in each mapper output file. The reducer checks this field before aggregating results.
# Mapper output format
{
    "chunk_id": "chunk_aa",
    "status": "failed",
    "scenarios": [
        {"name": "login_flow", "passed": true, "duration": 2.3},
        {"name": "payment_flow", "passed": false, "error": "Timeout connecting to payment gateway"}
    ]
}
The reducer collects all mapper outputs and generates a summary that includes:
- Total scenarios executed.
- Total passed and failed.
- List of failed scenarios with error messages.
- Mapper IDs that returned failures.
- Execution time per mapper.
This summary artifact becomes the single source of truth for debugging. Engineers open the summary, see which mapper failed, and pull the corresponding log stream from the centralized aggregator.
Retry Logic for Transient Failures
Network timeouts, resource contention, and temporary service outages cause transient failures. Implement retry logic at the mapper level to reduce false positives in test results.
# Mapper with retry logic
import time
from functools import wraps

def retry(max_attempts=3, delay=2):
    def decorator(func):
        @wraps(func)
        def wrapper(*args, **kwargs):
            for attempt in range(1, max_attempts + 1):
                try:
                    return func(*args, **kwargs)
                except Exception as e:
                    logger.warning(f"Attempt {attempt} failed: {e}")
                    if attempt == max_attempts:
                        raise
                    time.sleep(delay * attempt)
            return None
        return wrapper
    return decorator

@retry(max_attempts=3, delay=2)
def execute_test(scenario):
    # Test execution logic here
    pass
Set retry limits based on the expected transient failure rate in your environment. Three retries with exponential backoff works well for most cloud-based setups. Track retry counts as a metric to identify scenarios that consistently fail, indicating a permanent issue rather than a transient one.
Handling Stuck Mappers
A mapper may hang indefinitely due to deadlocks, infinite loops, or unresponsive external services. Set timeout limits on mapper execution to prevent the entire pipeline from stalling.
# Mapper with timeout
import signal

class TimeoutError(Exception):
    pass

def timeout_handler(signum, frame):
    raise TimeoutError("Mapper execution exceeded time limit")

def run_mapper_with_timeout(scenarios, timeout_seconds=300):
    signal.signal(signal.SIGALRM, timeout_handler)
    signal.alarm(timeout_seconds)
    try:
        for scenario in scenarios:
            execute_test(scenario)
    except TimeoutError:
        logger.error("Mapper timed out")
        raise
    finally:
        signal.alarm(0)
Set the timeout value to twice the expected maximum execution time for a chunk. Monitor timeout occurrences as a metric. Frequent timeouts indicate data skew or resource constraints that require workload rebalancing.
Distributed Tracing
For complex E2E tests that span multiple microservices, distributed tracing provides end-to-end visibility. Tools like Jaeger or Zipkin trace a single test scenario across service boundaries.
Instrument the mapper to propagate trace context to the system under test. Each test scenario carries a unique trace ID. When a scenario fails, the trace shows every service call and database query that occurred during execution.
# Propagating trace context in mapper
from opentelemetry import trace
from opentelemetry.propagate import inject

tracer = trace.get_tracer(__name__)

def run_scenario_with_tracing(scenario):
    with tracer.start_as_current_span(scenario["name"]) as span:
        headers = {}
        inject(headers)
        response = requests.get(
            f"{BASE_URL}{scenario['endpoint']}",
            headers=headers
        )
        span.set_attribute("http.status_code", response.status_code)
        if response.status_code >= 400:
            span.set_status(trace.Status(trace.StatusCode.ERROR))
Distributed tracing turns a cryptic error message into a visual map of the failure. Engineers see exactly which service returned a 500 error or which database query timed out.
Monitoring and debugging in a distributed E2E test environment require intentional instrumentation from the start. Centralized logs, real-time metrics, retry logic, timeouts, and distributed tracing transform chaos into clarity. Without these tools, every failure becomes a manual investigation that erodes the time savings gained from parallel execution.
Real-World Use Cases and Success Stories

Theory and architecture diagrams only prove so much. Real organizations have deployed E2E Test MapReduce Architecture and measured the results. Their experiences reveal the practical benefits and the unexpected challenges that emerge at scale.
E-Commerce Platform: 80% Reduction in Regression Test Time
A major e-commerce company maintained a regression test suite of 12,000 E2E scenarios. Running sequentially took over four hours. This blocked deployments to production more than once per day. The team implemented a MapReduce pipeline using Apache Spark to distribute test execution across 16 worker nodes.
The Map phase split the test suite into 128 chunks. Each worker executed roughly 94 scenarios. The Reduce phase aggregated pass/fail counts and generated a summary report. Total execution time dropped from 4 hours to 48 minutes. The team later optimized chunk sizing and reduced it further to 35 minutes.
The key insight from this deployment was chunk granularity. Too few chunks left workers idle. Too many chunks created overhead from task scheduling and data serialization. The team settled on 8 scenarios per chunk as the sweet spot for their infrastructure.
Financial Services: Parallel Execution Across Regulatory Regions
A fintech company faced a different constraint. Their E2E tests needed to run against multiple regional deployments to verify compliance with local regulations. Each region had its own database, API endpoints, and authentication flows. Running tests sequentially against three regions took six hours.
They implemented a MapReduce pipeline where each mapper executed the full test suite against a single region. Three mappers ran in parallel, each targeting a different region. The reducer collected results and flagged any region-specific failures.
Execution time dropped from six hours to two hours and fifteen minutes. The company gained the ability to run the full compliance suite twice per business day instead of once. The architecture also simplified debugging. A failure in one region did not block results from the other two regions.
SaaS Provider: Scaling CI/CD Velocity Without Hardware Expansion
A SaaS company with 500 employees ran 8,000 E2E tests on every pull request. Their CI/CD pipeline used a single Jenkins agent with 32 cores. Test execution took 90 minutes. Developers waited nearly two hours for feedback before merging code.
Instead of buying more hardware, the team adopted a cloud-native MapReduce approach using AWS Lambda. Each test scenario became a separate Lambda invocation. The Map phase was implicit: Lambda handled parallel execution automatically. A central coordinator function acted as the reducer, collecting results and updating the pull request status.
Execution time dropped to 12 minutes. The cost per run was $3.47. The team avoided a capital expenditure on physical servers and gained the ability to scale test execution up or down based on demand. The architecture handled peak loads during release weeks without manual intervention.
Healthcare Technology: Handling Data Consistency Across Distributed Mappers
A healthcare startup needed to run E2E tests against a system that processed patient data across multiple microservices. Each test scenario required a unique patient record to avoid state collisions. Sequential execution worked but took too long for a team shipping daily releases.
The team implemented a MapReduce pipeline where the Map phase generated unique test data per mapper. Each mapper received a chunk of scenarios and a unique data generation seed. The seed ensured that no two mappers created overlapping patient records. The reducer validated that all generated data was cleaned up after the test run.
Execution time dropped from 3 hours to 45 minutes. The team eliminated data collision failures that had plagued their earlier attempts at parallel testing. The seed-based data generation approach became a reusable pattern across their entire testing organization.
Key Metrics Across Deployments
These real-world implementations share common results:
- Execution time reduction: 70% to 85% decrease across all case studies.
- Deployment frequency: Teams moved from daily to multiple daily deployments.
- Developer feedback loop: Time from commit to test results shrank from hours to minutes.
- Infrastructure cost: Cloud-based implementations cost $2 to $5 per test run, far less than dedicated hardware.
- Failure detection rate: Distributed execution caught flaky tests faster because failures appeared consistently across multiple mapper runs.
Each organization faced unique constraints. E-commerce needed raw speed. Fintech needed regional isolation. SaaS needed elastic scaling. Healthcare needed data consistency. The MapReduce architecture adapted to each requirement without forcing a one-size-fits-all solution.
Challenges and Limitations of the Architecture
E2E Test MapReduce Architecture delivers clear benefits for large test suites. But it is not a universal solution. Teams must understand the trade-offs before adopting this approach. The architecture introduces complexity that can outweigh its advantages for smaller projects.
Setup Complexity and Learning Curve
Implementing a MapReduce pipeline for E2E tests requires expertise in distributed systems. Teams must configure cluster infrastructure, manage task scheduling, and handle data serialization. A team without prior experience in Apache Hadoop or Apache Spark will spend weeks just on the initial setup.
The learning curve extends to test design. Engineers accustomed to sequential test execution must rethink how they structure scenarios for parallel processing. Tests must be stateless and independent. This requirement often forces a rewrite of existing test suites rather than a simple configuration change.
Small teams with limited DevOps bandwidth should think twice. The time spent building and maintaining the MapReduce pipeline could be better invested in optimizing sequential test execution or adopting simpler parallelization strategies like sharding.
Data Dependency Management
E2E tests often depend on shared state. A test might require a specific user account, a database record, or an API token. In sequential execution, tests can share these resources safely. In a MapReduce pipeline, multiple mappers run simultaneously. Shared state becomes a source of race conditions and flaky failures.
Teams must implement strategies to isolate test data across mappers. Options include generating unique data per mapper, using separate database schemas, or spinning up isolated environments. Each approach adds complexity and infrastructure cost.
The healthcare startup in the previous section solved this with seed-based data generation. But not every team has the resources to implement such a solution. For teams with tightly coupled test dependencies, the overhead of data isolation can negate the performance gains from parallel execution.
Debugging Distributed Test Failures
When a test fails in sequential execution, the root cause is usually clear. The test log shows the exact step that failed. In a MapReduce pipeline, a failure might occur in any mapper. The log files are spread across multiple worker nodes. Correlating failures with specific inputs requires additional tooling.
Network latency adds another layer of uncertainty. A mapper might fail because of a timeout rather than a genuine application defect. Distinguishing infrastructure failures from test failures demands careful log analysis and retry logic.
Teams should invest in centralized logging and monitoring from day one. Tools like ELK Stack or Grafana become essential. Without them, debugging a distributed test run can take longer than running the entire test suite sequentially.
Overhead for Small Test Suites
MapReduce introduces overhead. Task scheduling, data serialization, network communication, and result aggregation all consume time and resources. For a test suite with fewer than 500 scenarios, this overhead often exceeds the time saved by parallel execution.
A team running 200 E2E tests might see execution time increase from 10 minutes to 15 minutes after implementing MapReduce. The architecture is designed for scale. It shines when test suites exceed 1,000 scenarios and execution times stretch beyond an hour.
Teams with small test suites should evaluate simpler alternatives first. Parallel test execution within a single machine, test sharding across multiple CI agents, or containerized test environments often provide sufficient speedup without the complexity of a full MapReduce pipeline.
Cost Implications for Cloud-Based Setups
Cloud-based MapReduce implementations charge per compute unit. Running 100 mappers on AWS Lambda for 12 minutes costs roughly $3.50 per run. For a team executing 50 test runs per day, the monthly cost approaches $5,000. This cost scales linearly with test suite size and execution frequency.
On-premises clusters avoid variable cloud costs but require upfront hardware investment and ongoing maintenance. A 16-node cluster capable of running large E2E test suites can cost $50,000 or more in hardware alone.
Teams must calculate their break-even point. For organizations running tests fewer than 10 times per day, the cost of cloud-based MapReduce may exceed the value of faster feedback. For teams with continuous deployment pipelines, the cost is usually justified by increased deployment frequency and developer productivity.
When Not to Use This Architecture
E2E Test MapReduce Architecture is not the right choice for every scenario. Avoid it when:
- Test suite has fewer than 500 scenarios. The overhead of distributed execution outweighs the benefits.
- Tests have strong data dependencies. Shared state across tests makes parallelization difficult and error-prone.
- Team lacks distributed systems expertise. The learning curve and maintenance burden will slow down development.
- Budget constraints limit cloud infrastructure. The cost per test run adds up quickly for high-frequency pipelines.
- Sequential execution time is under 30 minutes. The feedback loop is already fast enough for most development workflows.
In these cases, simpler parallelization strategies or optimized sequential execution will deliver better results with less complexity. The MapReduce architecture is a powerful tool, but only when applied to the right problem at the right scale.
Best Practices for Implementation

Adopting the E2E Test MapReduce Architecture requires discipline. The following practices emerged from real implementations across multiple organizations. Apply them to reduce risk and maximize the return on your infrastructure investment.
Start with a Pilot Project
Do not migrate your entire test suite on day one. Select a single test module or feature area with at least 200 scenarios. Run the pilot for two weeks. Measure execution time, failure rates, and infrastructure costs. Compare these metrics against your baseline sequential execution.
The pilot reveals hidden issues early. Data dependency problems surface. Network latency patterns become visible. Your team learns the operational quirks of the distributed system without risking the entire CI pipeline. After the pilot, you have concrete data to justify broader adoption or to pivot to a simpler approach.
Choose a pilot module with tests that are already stable and independent. Flaky tests in the pilot will erode confidence in the architecture. Start with your most reliable test scenarios.
Design Tests for Idempotency
Every test in the MapReduce pipeline must produce the same result when executed once or multiple times. Idempotent tests eliminate the need for complex state cleanup between mapper runs. They also simplify retry logic when a mapper fails due to transient infrastructure issues.
To achieve idempotency, use unique identifiers for every test resource. Append a UUID to database records, API endpoints, and file paths. Avoid tests that depend on global counters or shared sequence numbers. Design each test to create its own data, run its assertions, and clean up after itself.
Idempotent tests also improve debugging. When a test fails, you can rerun it in isolation without worrying about side effects from previous executions. This property alone saves hours of investigation time per week.
Monitor Resource Usage Continuously
MapReduce clusters consume compute, memory, and network bandwidth. Without monitoring, you cannot detect resource contention or cost overruns. Set up dashboards that track mapper execution time, CPU utilization, memory consumption, and network I/O per worker node.
Alert on anomalies. A mapper that takes three times longer than its peers indicates data skew. A sudden spike in memory usage suggests a memory leak in the test framework. Network bandwidth saturation points to inefficient data serialization or excessive inter-mapper communication.
Use the same monitoring tools you already employ for production systems. Prometheus with Grafana works well for on-premises clusters. Cloud providers offer built-in monitoring for their MapReduce services. Integrate these metrics into your existing operations dashboards to avoid tool sprawl.
Implement Retry Logic with Exponential Backoff
Distributed systems experience transient failures. Network packets drop. Worker nodes restart. API rate limits trigger. Your MapReduce pipeline must handle these events without failing the entire test run.
Implement retry logic at the mapper level. When a mapper fails, wait one second and retry. If it fails again, wait two seconds. Continue doubling the wait time up to a maximum of 32 seconds. After three retries, mark the mapper as failed and proceed with the remaining tests.
Log every retry attempt with the error message and the wait time. This data helps distinguish between transient failures and genuine application defects. A mapper that succeeds on retry is usually a network issue. A mapper that fails all three retries requires human investigation.
Document the Architecture Thoroughly
The E2E Test MapReduce Architecture introduces concepts unfamiliar to many QA engineers. New team members need clear documentation to understand the system and contribute effectively. Write documentation that covers the following areas:
- Architecture diagram showing the flow from test trigger to mapper distribution to result aggregation.
- Data format specification describing how test inputs and outputs are serialized and deserialized.
- Configuration guide explaining each parameter in the MapReduce pipeline and its effect on performance and cost.
- Troubleshooting playbook with common failure modes and their resolutions.
- Cost estimation worksheet that teams can use to predict monthly infrastructure expenses based on test suite size and execution frequency.
Keep the documentation in your version control system alongside the test code. Update it whenever you change the pipeline configuration or add new features. Outdated documentation causes more confusion than no documentation at all.
Validate Results with a Sequential Baseline
Run the same test suite sequentially and through the MapReduce pipeline for every release. Compare the results. Any test that passes sequentially but fails in the MapReduce pipeline requires investigation. The failure might indicate a data consistency issue, a race condition, or a bug in the mapper logic.
Maintain this validation until the MapReduce pipeline has run successfully for 100 consecutive releases. After that point, you can reduce the frequency to spot checks. But always keep the ability to run the sequential baseline on demand. It is your safety net when debugging mysterious failures.
Scale Incrementally
Start with two mapper nodes. Run your pilot. Add nodes one at a time as your confidence grows. Measure the performance improvement from each additional node. The gains diminish after a certain point due to scheduling overhead and network contention.
For most teams, the optimal number of mapper nodes is between 8 and 16. Beyond that, the cost per additional node exceeds the time saved. Use your monitoring data to find the sweet spot for your specific workload. Do not assume that more nodes always means faster execution.
Incremental scaling also makes cost management easier. You can track the marginal cost of each node and stop adding resources when the return on investment drops below your threshold.
Conclusion and Future Directions

The E2E Test MapReduce Architecture transforms how teams handle large-scale test suites. It replaces sequential bottlenecks with parallel execution. It turns hours of waiting into minutes of verification. The architecture is not simple, but the return on investment justifies the complexity for organizations with growing test portfolios.
Three core lessons stand out from real implementations. First, idempotent test design is non-negotiable. Without it, distributed execution produces unreliable results. Second, monitoring and observability must be built in from day one. You cannot debug distributed failures without visibility into each mapper’s behavior. Third, start small and scale incrementally. A pilot project with 200 tests reveals more than a theoretical analysis ever will.
Emerging Trends
The architecture continues to evolve. Serverless MapReduce services from cloud providers eliminate cluster management overhead. AWS Lambda, Google Cloud Functions, and Azure Functions can run mapper tasks without provisioning servers. The cost model shifts from fixed infrastructure expenses to pay-per-execution pricing. This makes the architecture accessible to smaller teams with variable test workloads.
AI-driven test partitioning is another frontier. Machine learning models analyze historical test execution data to predict which tests are likely to fail. The partitioner assigns higher priority to those tests and distributes them across mappers for faster feedback. Early experiments show a 40 percent reduction in time-to-failure detection for regression suites.
Containerized test environments are becoming standard. Docker containers encapsulate each mapper’s dependencies, browser versions, and operating system configurations. Kubernetes orchestrates container placement across worker nodes. This approach eliminates environment drift and makes test results reproducible across different infrastructure setups.
Experiment and Adapt
The best way to understand this architecture is to build it. Start with a small test suite. Use a simple MapReduce framework like Hadoop Streaming or a lightweight Python implementation. Run your first distributed test execution. Observe the behavior. Measure the results.
Do not wait for the perfect tool or the ideal configuration. The architecture is forgiving of early mistakes. Each failure teaches you something about your test suite, your infrastructure, and your team’s operational maturity. The knowledge gained from building and operating a distributed test pipeline is valuable regardless of whether you adopt the architecture permanently.
The future of E2E testing is parallel, distributed, and intelligent. The MapReduce paradigm provides a proven foundation for that future. Start your experiment today. The time you save tomorrow will pay for the effort many times over.
Häufig gestellte Fragen zur E2E-Test-MapReduce-Architektur
Was ist die E2E-Test-MapReduce-Architektur?
Es ist ein Framework, das das MapReduce-Paradigma auf End-to-End-Tests anwendet. Dabei werden Testsuiten in unabhängige Szenarien aufgeteilt (Map-Phase), parallel auf mehreren Workern ausgeführt und die Ergebnisse dann zu einem einzigen Bericht zusammengeführt (Reduce-Phase). Dies verkürzt die Ausführungszeit drastisch.
Wie reduziert diese Architektur die Testausführungszeit?
Anstatt Tests nacheinander auszuführen, führt die MapReduce-Architektur sie parallel aus. Eine Testsuite, die sequenziell 10 Stunden dauert, kann mit 60 parallelen Mappern in etwa 10 Minuten abgeschlossen werden, was die Feedbackschleife für Entwickler erheblich verkürzt.
Was sind die Hauptkomponenten dieser Architektur?
Die Hauptkomponenten sind der Mapper und der Reducer. Der Mapper führt einzelne Testszenarien isoliert aus (Setup, Ausführung, Teardown). Der Reducer sammelt alle Ergebnisse, aggregiert sie (z. B. Gesamtzahl bestanden/nicht bestanden) und erstellt einen zusammenfassenden Testbericht.
Wie wird die Datenkonsistenz bei der parallelen Ausführung sichergestellt?
Um Konflikte zu vermeiden, werden Strategien wie Datenbank-Snapshots, idempotentes Test-Setup, Namespacing oder deterministische Datengenerierung eingesetzt. Diese stellen sicher, dass jeder Mapper isolierte Daten sieht und sich Tests nicht gegenseitig stören.
Wann sollte ich diese Architektur nicht verwenden?
Sie ist nicht ideal für kleine Testsuiten (unter 500 Szenarien), wenn die sequenzielle Ausführungszeit unter 30 Minuten liegt oder wenn Ihr Team nicht über die nötige Expertise in verteilten Systemen verfügt. Der Overhead kann in diesen Fällen die Vorteile überwiegen.
Leave a Reply